 AI PPT Maker
 Templates
 PPT Bundles
 Design Services
 Business PPTs
 Business Plan
 Management
 Strategy
 Introduction PPT
 Roadmap
 Self Introduction
 Timelines
 Process
 Marketing
 Agenda
 Technology
 Medical
 Startup Business Plan
 Cyber Security
 Dashboards
 SWOT
SWOT Proposals
 Education
 Pitch Deck
 Digital Marketing
 KPIs
KPIs Project Management
 Product Management
 Artificial Intelligence
 Target Market
 Communication
 Supply Chain
 Google Slides
 Research Services
 One Pagers
 All Categories
Chart infographic PowerPoint Presentation Templates and Google Slides
SHOW
- 60
- 120
- 180
DISPLAYING: 60 of 782 Item(s)
Page


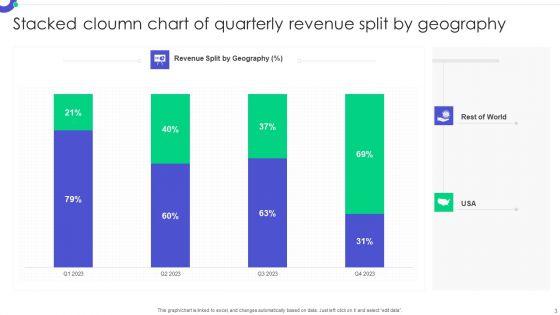

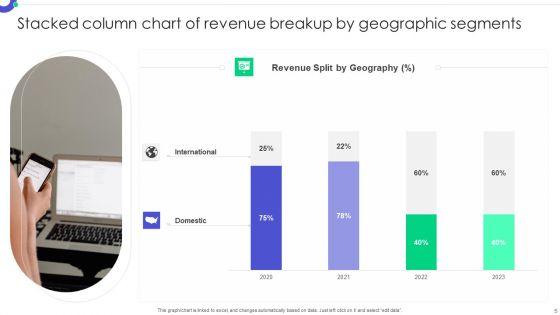


Boost your confidence and team morale with this well-structured Stacked Cloumn Chart Infographic Ppt PowerPoint Presentation Complete Deck With Slides. This prefabricated set gives a voice to your presentation because of its well-researched content and graphics. Our experts have added all the components very carefully, thus helping you deliver great presentations with a single click. Not only that, it contains a set of twelve slides that are designed using the right visuals, graphics, etc. Various topics can be discussed, and effective brainstorming sessions can be conducted using the wide variety of slides added in this complete deck. Apart from this, our PPT design contains clear instructions to help you restructure your presentations and create multiple variations. The color, format, design anything can be modified as deemed fit by the user. Not only this, it is available for immediate download. So, grab it now.
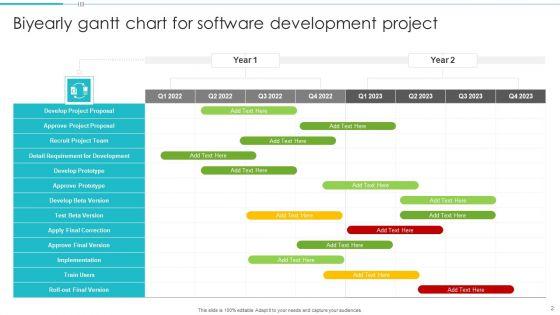

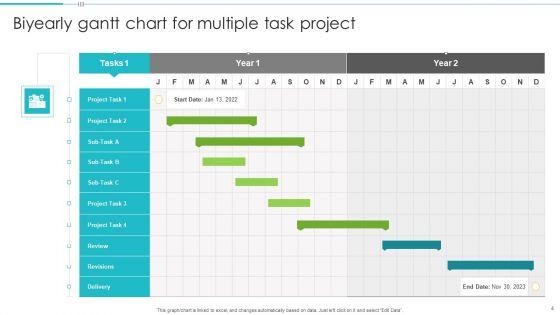
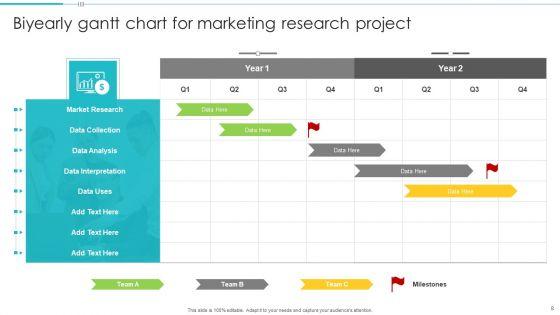
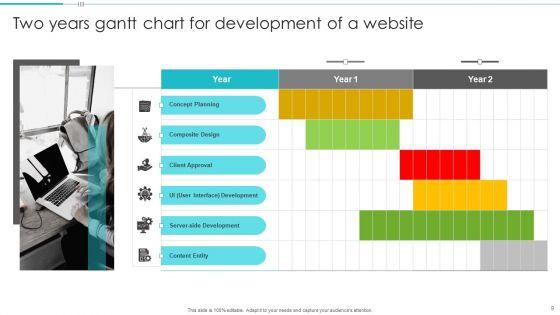
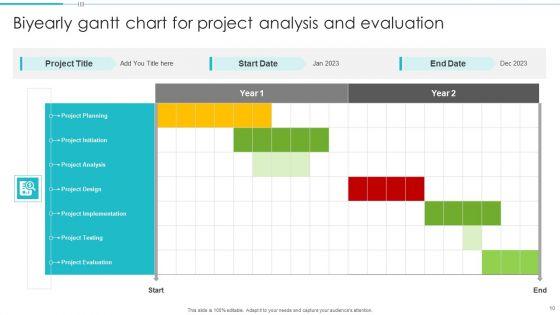


If designing a presentation takes a lot of your time and resources and you are looking for a better alternative, then this Biyearly Gantt Chart Infographic Ppt PowerPoint Presentation Complete With Slides is the right fit for you. This is a prefabricated set that can help you deliver a great presentation on the topic. All the tweleve slides included in this sample template can be used to present a birds-eye view of the topic. These slides are also fully editable, giving you enough freedom to add specific details to make this layout more suited to your business setting. Apart from the content, all other elements like color, design, theme are also replaceable and editable. This helps in designing a variety of presentations with a single layout. Not only this, you can use this PPT design in formats like PDF, PNG, and JPG once downloaded. Therefore, without any further ado, download and utilize this sample presentation as per your liking.
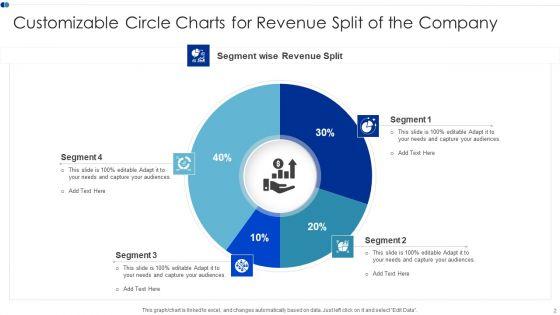
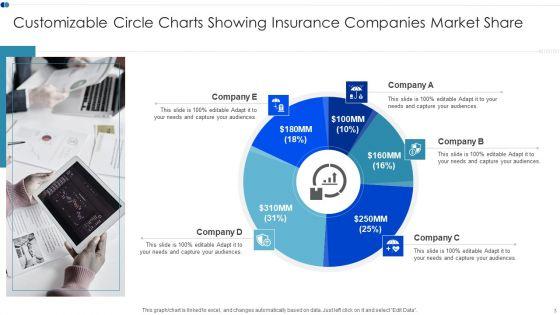
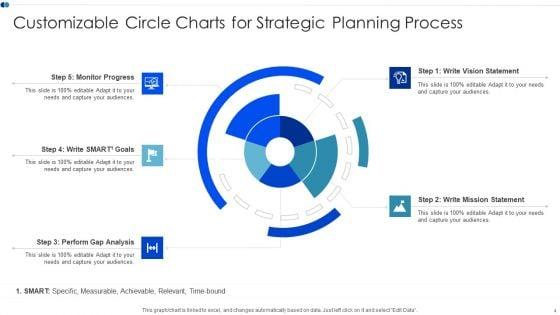
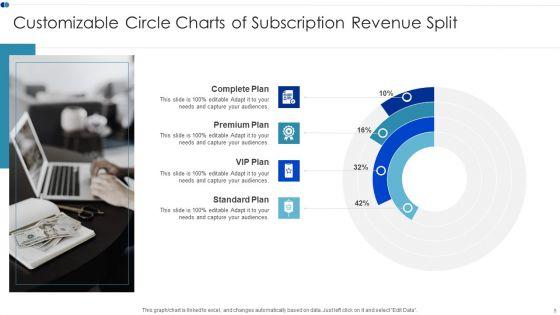


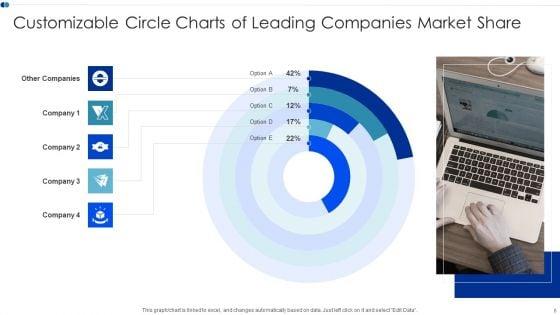

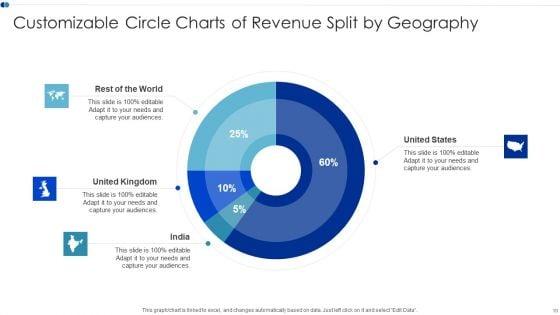
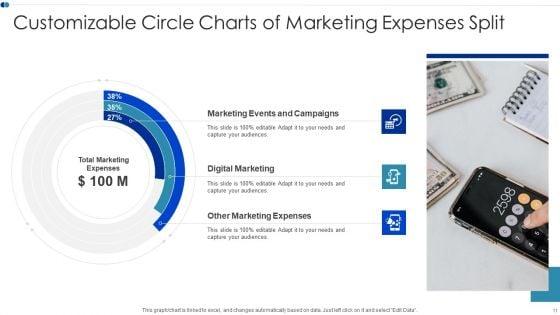

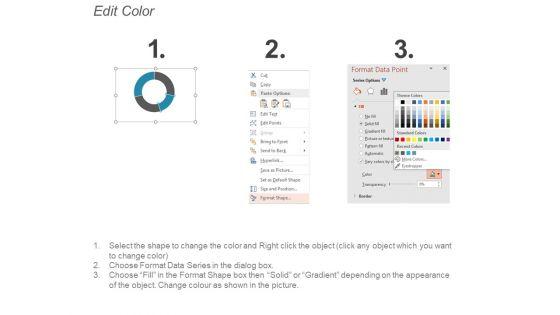
Improve your presentation delivery using this Customizable Circle Charts Infographic Ppt PowerPoint Presentation Complete Deck With Slides. Support your business vision and objectives using this well-structured PPT deck. This template offers a great starting point for delivering beautifully designed presentations on the topic of your choice. Comprising twelve this professionally designed template is all you need to host discussion and meetings with collaborators. Each slide is self-explanatory and equipped with high-quality graphics that can be adjusted to your needs. Therefore, you will face no difficulty in portraying your desired content using this PPT slideshow. This PowerPoint slideshow contains every important element that you need for a great pitch. It is not only editable but also available for immediate download and utilization. The color, font size, background, shapes everything can be modified to create your unique presentation layout. Therefore, download it now.


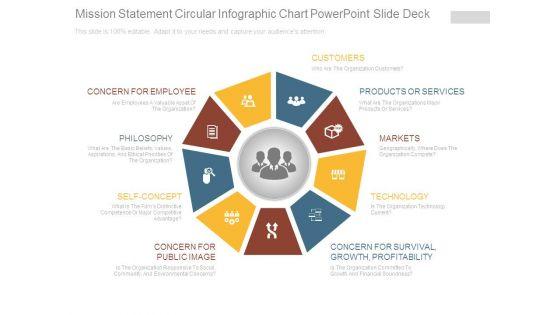


This is a mission statement circular infographic chart powerpoint slide deck. This is a nine stage process. The stages in this process are customers, products or services, markets, technology, concern for survival growth profitability, concern for public image, self concept, philosophy, concern for employee.


This is a project tracking chart ppt infographics. This is a six stage process. The stages in this process are overall project status is green, schedule, resourcing, budget, risks, issues, benefits, the project schedule is on track, resourcing is adequate, project is within control, all project risks are in control, project issues need attention, project benefits are off track and need to be fixed.


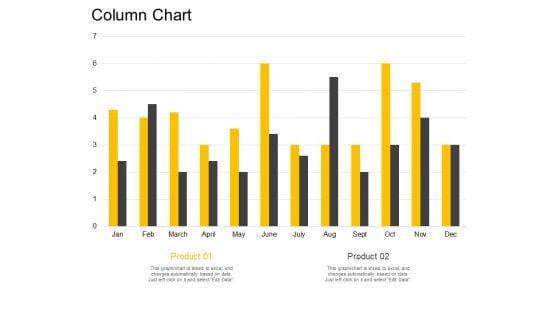


Presenting this set of slides with name column chart bar ppt powerpoint presentation infographics slide download. The topics discussed in these slides are marketing, business, management, planning, strategy. This is a completely editable PowerPoint presentation and is available for immediate download. Download now and impress your audience.
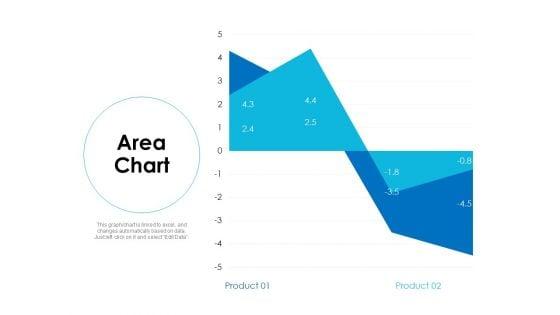


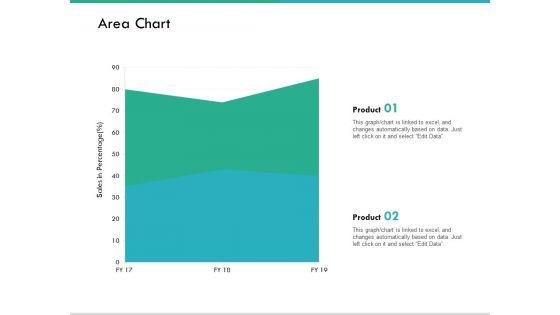
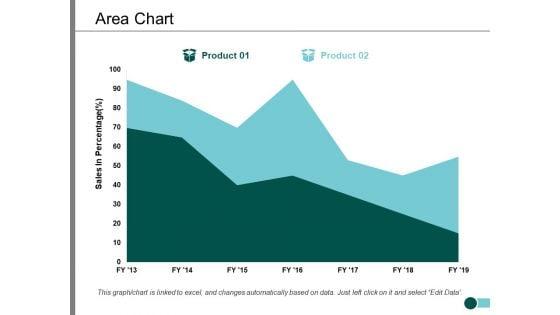
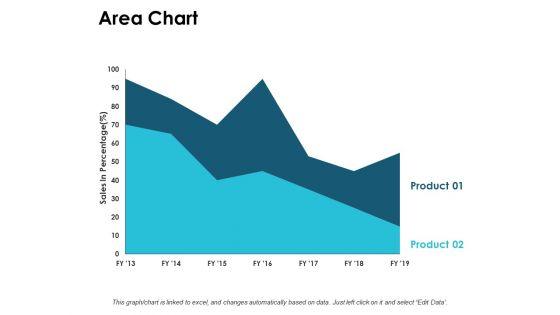
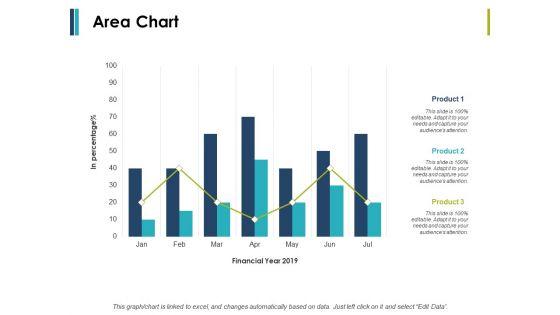
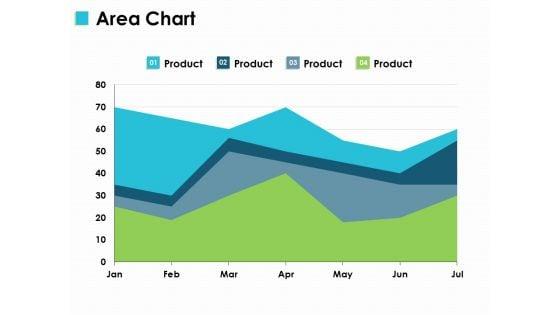
Presenting this set of slides with name area chart analysis ppt powerpoint presentation infographics aids. The topics discussed in these slides are area chart, finance, marketing, investment, analysis. This is a completely editable PowerPoint presentation and is available for immediate download. Download now and impress your audience.


Presenting this set of slides with name area chart graph ppt powerpoint presentation infographic template template. The topics discussed in these slides are marketing, business, management, planning, strategy. This is a completely editable PowerPoint presentation and is available for immediate download. Download now and impress your audience.


Presenting this set of slides with name quarterly sales growth chart for financial report ppt powerpoint presentation ideas infographics. The topics discussed in these slides are revenue trend, bar chart, financial. This is a completely editable PowerPoint presentation and is available for immediate download. Download now and impress your audience.
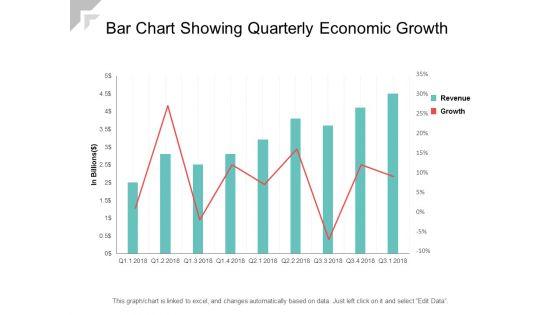


Presenting this set of slides with name bar chart showing quarterly economic growth ppt powerpoint presentation infographic template slideshow. The topics discussed in these slides are revenue trend, bar chart, financial. This is a completely editable PowerPoint presentation and is available for immediate download. Download now and impress your audience.


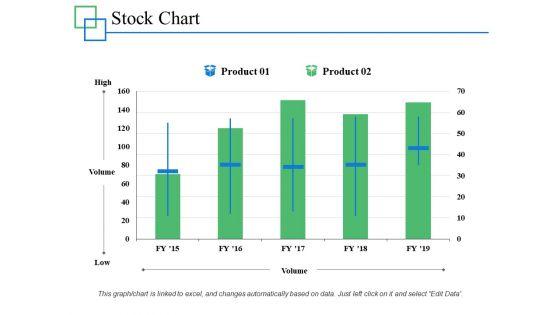
Presenting this set of slides with name volume high low close chart ppt powerpoint presentation infographic template example file. The topics discussed in these slides are finance, marketing, management, investment, analysis. This is a completely editable PowerPoint presentation and is available for immediate download. Download now and impress your audience.
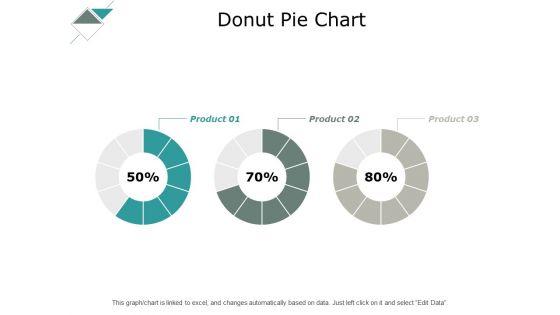


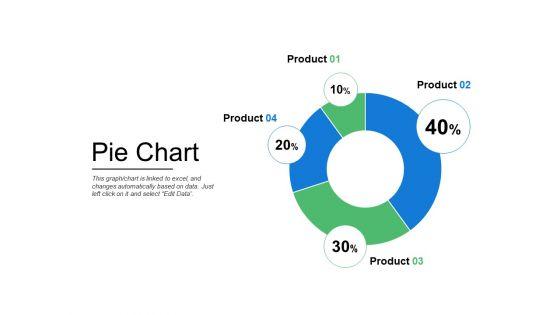
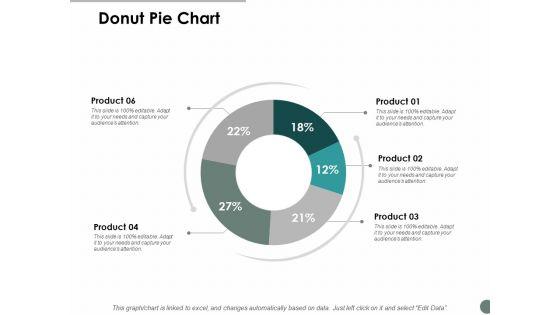
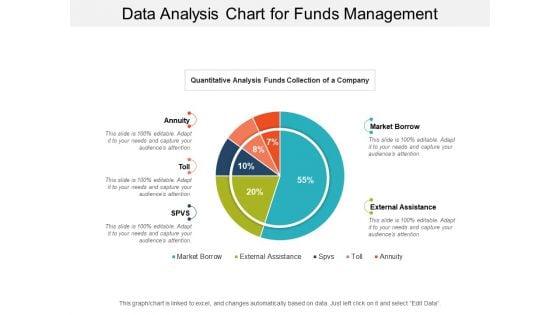
Presenting this set of slides with name donut pie chart analysis ppt powerpoint presentation infographics maker. The topics discussed in these slides are finance, marketing, management, investment, analysis. This is a completely editable PowerPoint presentation and is available for immediate download. Download now and impress your audience.
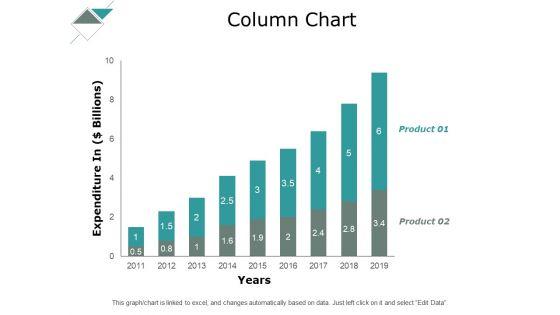
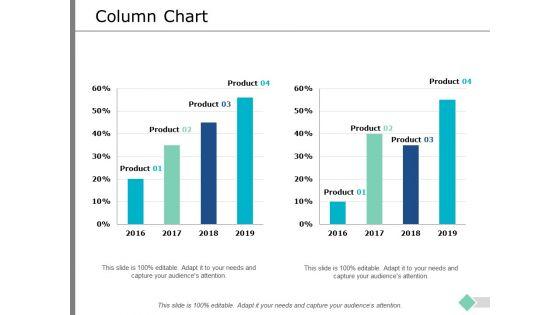
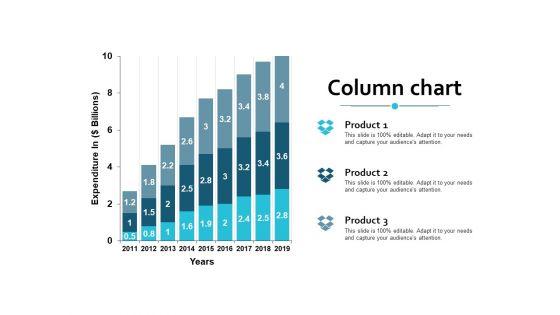
Presenting this set of slides with name column chart analysis ppt powerpoint presentation infographics layout. The topics discussed in these slides are finance, marketing, management, investment, analysis. This is a completely editable PowerPoint presentation and is available for immediate download. Download now and impress your audience.


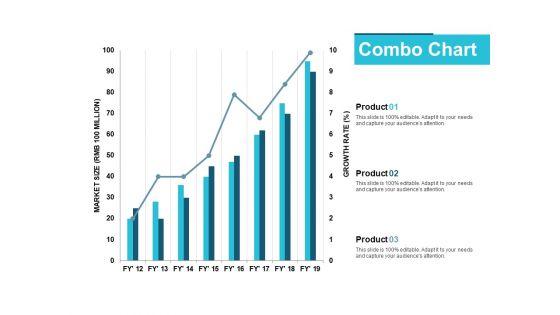
Presenting this set of slides with name combo chart analysis ppt powerpoint presentation infographic template infographics. The topics discussed in these slides are finance, marketing, management, investment, analysis. This is a completely editable PowerPoint presentation and is available for immediate download. Download now and impress your audience.
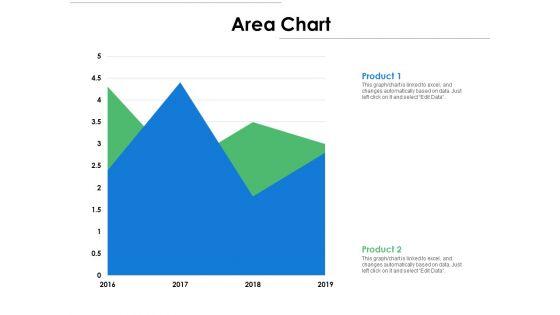


Presenting this set of slides with name area chart analysis ppt powerpoint presentation infographic template master slide. The topics discussed in these slides are finance, marketing, management, investment, analysis. This is a completely editable PowerPoint presentation and is available for immediate download. Download now and impress your audience.


Presenting this set of slides with name bar chart analysis ppt powerpoint presentation infographic template infographics. The topics discussed in these slides are bar chart, finance, marketing, management, investment. This is a completely editable PowerPoint presentation and is available for immediate download. Download now and impress your audience.
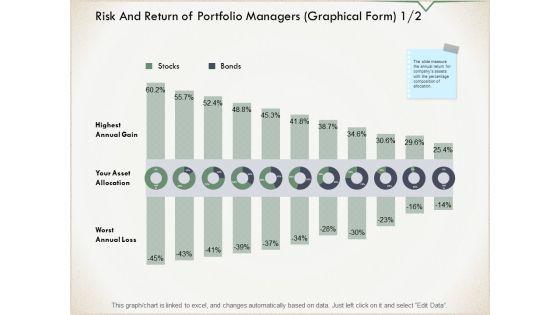


Presenting this set of slides with name risk and return of portfolio managers graphical form chart ppt powerpoint presentation infographic template slides. The topics discussed in these slides are marketing, business, management, planning, strategy. This is a completely editable PowerPoint presentation and is available for immediate download. Download now and impress your audience.
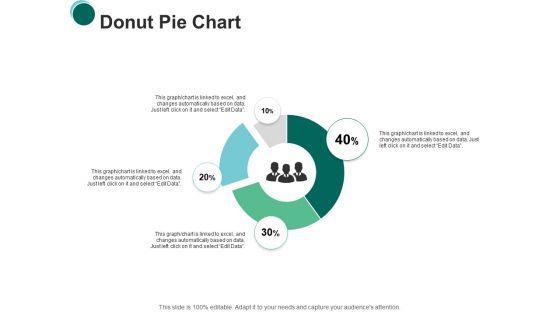


Presenting this set of slides with name donut pie chart finance ppt powerpoint presentation infographics slides. This is a four stage process. The stages in this process are finance, marketing, management, investment, analysis. This is a completely editable PowerPoint presentation and is available for immediate download. Download now and impress your audience.
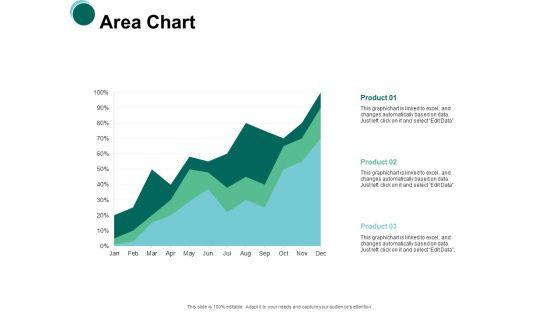


Presenting this set of slides with name area chart graph ppt powerpoint presentation infographics slide download. The topics discussed in these slides are marketing, business, management, planning, strategy. This is a completely editable PowerPoint presentation and is available for immediate download. Download now and impress your audience.
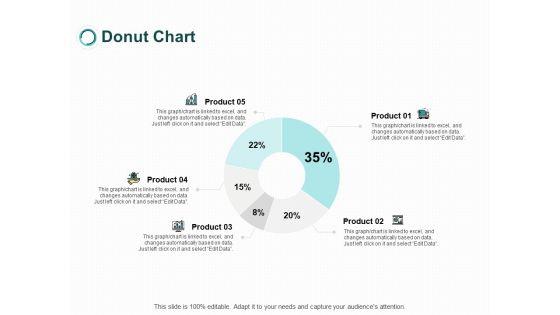


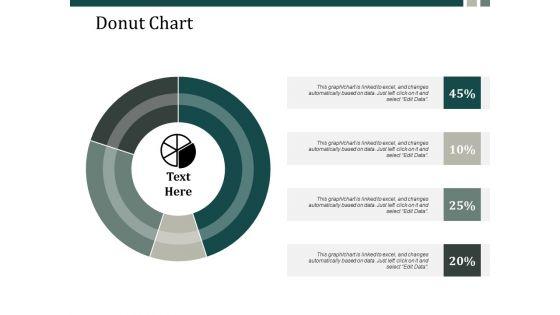
Presenting this set of slides with name donut chart finance ppt powerpoint presentation pictures infographics. The topics discussed in these slides are marketing, business, management, planning, strategy. This is a completely editable PowerPoint presentation and is available for immediate download. Download now and impress your audience.


SHOW
- 60
- 120
- 180
DISPLAYING: 60 of 782 Item(s)
Page